Dashboard
The Dashboard gives you an at-a-glance overview of your testing progress. TestFlair provides both a global dashboard and per-project dashboards.
Global Dashboard
Access the global dashboard by clicking Dashboard in the sidebar. It displays aggregated statistics across all your projects.
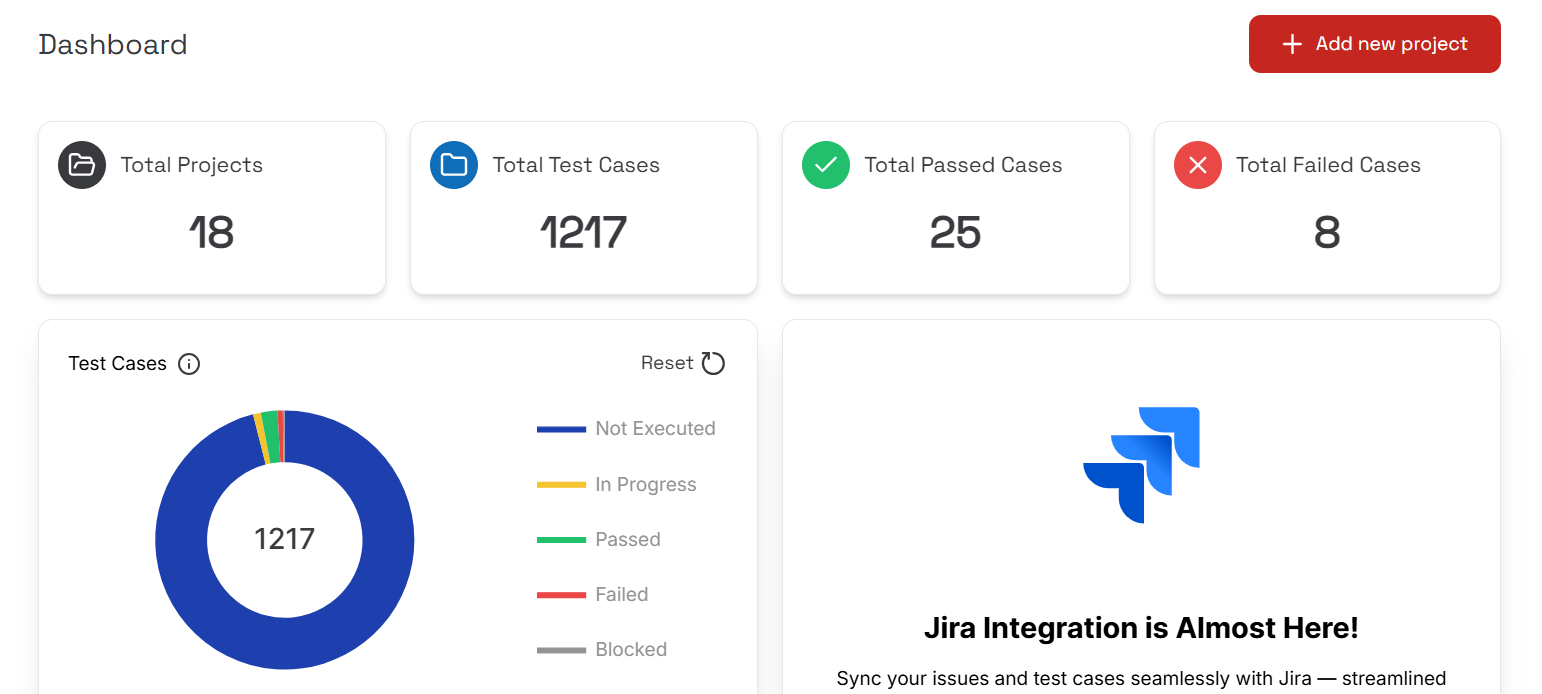
Project Statistics
Cards at the top show:
- Total Projects — Number of projects in your account
- Ongoing — Projects with active testing
- Completed — Projects with all tests passed
- Pending BRD — Projects waiting for requirements upload
Test Case Status Breakdown
A visual breakdown of test case statuses across all projects:
| Status | Description |
|---|---|
| Passed | Tests that completed successfully |
| Failed | Tests with one or more assertion failures |
| Blocked | Tests that cannot run due to dependencies |
| In Progress | Tests currently being executed |
| Not Executed | Tests that haven't been run yet |
A doughnut chart visualizes these statuses for quick assessment.

Bug Priority Breakdown
See open bugs grouped by priority level:
- Critical — Blocking issues that need attention right now
- High — Serious issues requiring immediate attention
- Medium — Important issues to address soon
- Low — Minor issues to fix when convenient
Test Executions
A chart of test execution activity over time, so you can see whether testing is keeping pace with development rather than only where it currently stands.
Project Insights
A summary panel highlighting where your projects need attention — which are progressing, which are stalled, and which are waiting on requirements.
Additional Statistics
- User Stories — Total count and generation status
- Test Scripts — Total generated scripts
Per-Project Dashboard
When you open a specific project, the project dashboard shows the same metrics scoped to that single project.
- Click Projects in the sidebar
- Select a project from the list
- The project dashboard loads automatically
The project dashboard includes the same statistics cards and charts, but filtered to show only data for the selected project.